QuickAir
Your time and money is valuable.

Get where you want to be when you want to be there.

Learn more about QuickAir

ABOUT US - QuickAir

We use machine learning to predict flight delays and cancellations before they occur to save you the hassle.

Responsive

With our models constantly being tuned and refined, continue to expect even better results as we expand our resources.

Passion

We understand the frustration of flight delays and cancellations. Our team is committed to getting you from A to B as fast as possible.

Design

We only use state of the art machine learning techniques to guarantee you the accuracy and precision you demand.

Support

We are always open to concerns and suggestions. If there's anything we can do to make your life easier, we are more than happy to hear what you have to say.

THE TEAM

We are QuickAir.

Andrew Wang

Andrew Wang

CO-CEO, Web Developer

Sophomore Caltech student majoring in computer science. Plays DIII basketball. Spends free time lifting weights.

David Kawashima

David Kawashima

CO-CEO, Data Science Specialist

Junior Caltech student majoring in computer science. Plays DIII basketball. Believes Lakers will win 2018 NBA finals.

Steven Brotz

Steven Brotz

Co-CEO, Lead Software Architect

Sophomore Caltech student majoring in computer science. Plays DIII basketball. Can solve Rubik's cube in less than 20 seconds.

Caitlin Chen

Caitlin Chen

Supervisor

Senior Caltech student majoring in computer science. Fashion connoisseur and hair expert. Avid anime fan.

OUR WORK

Current research and results


Importance

Airline flight delays and cancellations cost the airline industry an estimated $8 billion per year and passengers even more - $17 billion. Our product is aimed at predicting when these events occur so both airlines and passengers can plan better. A win win that saves money and time.


Dataset Specifications

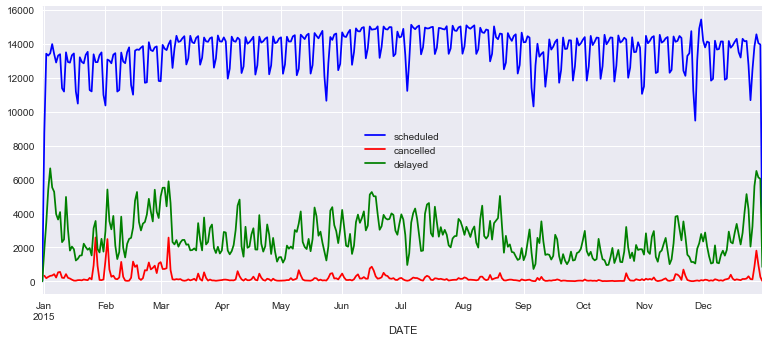
Currently, our dataset courtesy of Kaggle and U.S. Department of Transportation includes 5,819,079 domestic flights from 2015. For each flight, we compiled the following pieces of information:

  • Time : month, day of week, day of year, departure/arrival hour
  • Flight specifics : airline, origin/destination airport, distance of flight(miles)
  • Weather (arrival and departure locations): temperature, dew point, humidity, wind speed, precipitation, altitude, visibility, sky forecast
  • Airplane model: certificate date of airplane, model of airplane, manufacturer


Preliminary Data Analysis

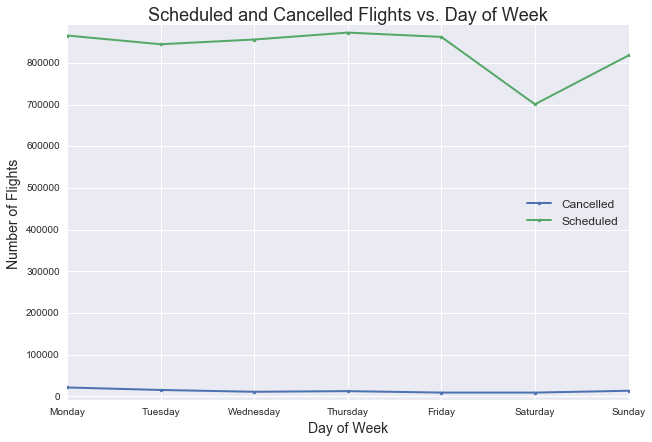
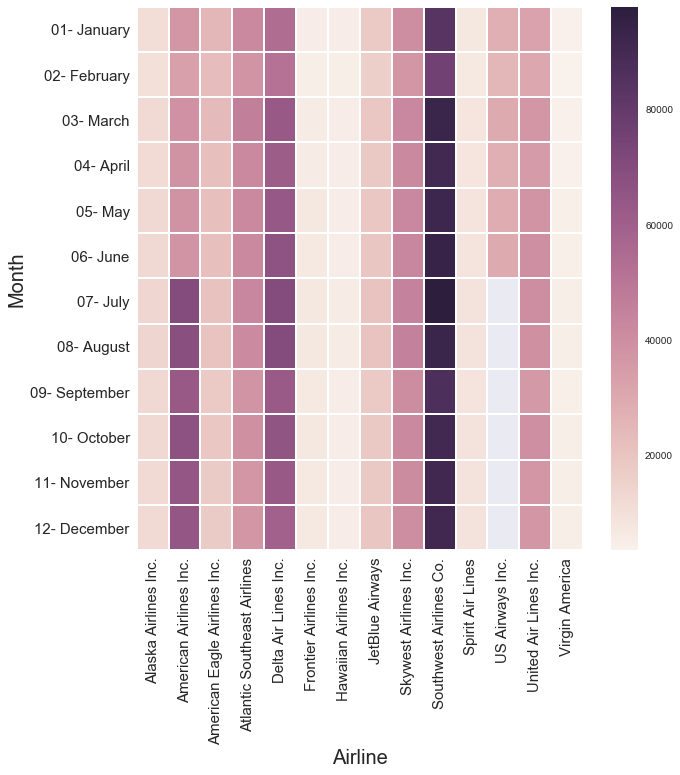
Before any machine learning, here are some general statistics and basic generalizations of our data.

  • Mean arrival time: +4.36 minutes
  • Mean arrival time for delays (delays defined as arriving at least 15 minutes after scheduled): +58.8 minutes
  • 18% flights delayed
  • 1.6% flights cancelled
Flights across year
Figure 1: Scheduled, cancelled, and delayed flights throughout 2015. Interesting to note the spike in cancellations and delays during the winter months.
Flights vs. Day of Week
Figure 2: Scheduled and cancelled flights per day of week. As expected, we have fewer flights scheduled for weekends as opposed to days of the work week.
Flights vs. Day of Week
Figure 3: Heat map of scheduled flights per airline. Observe the US Airways, American Airlines merger after June 2015.


Cancellation Classification

Our first machine learning task: to be able to correctly classify whether a given flight is cancelled or not.

Top features: Day of year, departure visibility/ wind speed/ air pressure/ temperature/ dew point, arrival temperature/ visibility/ air pressure, day of week

We use the following metrics:

  • Classification: Number of flights predicted correctly / Total number of flights
  • Precision: True positive / (True Positive + False Positive)
  • Recall: True positive / (True Positive + False Negative)
Cancellation Classification

Figure 4: Models used to predict flight cancellations. Balanced: Weights inversely proportional to class frequencies. Other models, such as Naive Bayes, had suboptimal results.

Top 5 Most Cancelled by Airport, Airline

  • Origin Airports: SUN (8.88%), ASE (7.63%), MKG (6.83%), LAW, CMX
  • Destination Airports: CMX (6.85%), MKG (6.56%), LAW (6.54%), TXK, DBQ
  • Airlines: American Eagle/Envoy (5.11%), ExpressJet (2.66%), US Airways (2.07%), Spirit, SkyWest

Note: For a airport/airline to be a potential candidate, it must have at least 365 flights a year.


Delay Classification

Our second machine learning task: to be able to correctly classify whether a given flight is delayed (+15 minutes past schedule) or not.

Top Features: Distance, departure dew-point / temp / altitude / humidity / hour, arrival temp / altitude / humidity / hour

Delay Classification

Figure 5: Models used to predict whether or not a flight is delayed. Max Depth is a method of early stopping for decision trees, therefore n/a for Naive Bayes models. Precision and Recall ill-defined for Decision Tree model because it predicts all negative.

Top 5 Most Cancelled by Airport, Airline

  • Origin Airports: ASE (34%), PBG (33%), OTH (35%), BPT, LGA
  • Destination Airports: ASE (36%), OTH (35%), BPT (32%), PBG, GUC
  • Airlines: Spirit (29%), JetBlue (25%), American (22%), Alaska, Delta


Delay Regression

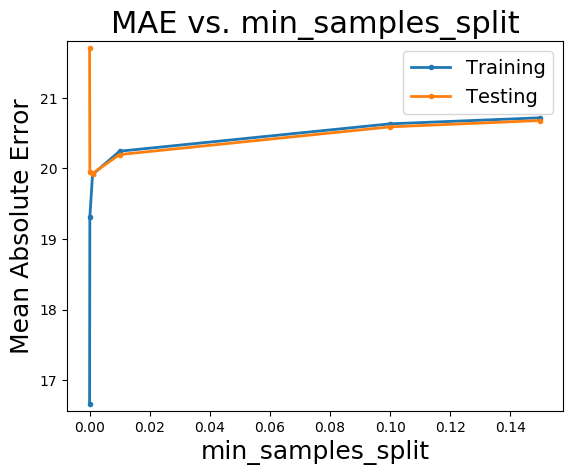
Our final machine learning task: if your flight is to be delayed, predict what your exact delay will be.
MAE = Mean Absolute Error

Features used: Airline, departure temperature/ humidity/ altitude/ visibility, arrival humidity, day of year, departure/arrival hour

Single tree regressor Random Forests

Figure 6: Varying parameters of single tree regressor and random forests (100 estimators). min_samples_split refers to the minimum number of samples required to split an internal node. min_samples_leaf refers to the minimum number of samples to be at a leaf node.
Unweighted KNN Boosted Regression Trees

Figure 7: Results for using KNN and AdaBoost regressor (50 estimators).

Top 5 Most Cancelled by Airport, Airline

  • Origin Airports: ASE (34%), PBG (33%), OTH (35%), BPT, LGA
  • Destination Airports: ASE (36%), OTH (35%), BPT (32%), PBG, GUC
  • Airlines: Spirit (29%), JetBlue (25%), American (22%), Alaska, Delta


Summary of Results

  • For cancellation classification: the minimum classification error achieved was 1.45% . Max. precision: 90.36%, recall: 70.15%
  • For delay classification, the minimum classification error achieved was 16.6% , slightly less than the naive 17.8%. Max precision: 67.52%, recall: 19.46%.
  • For regression, the least mean absolute error achieved was 19.05 minutes .


Current Work

  • Further optimization of models
  • Integrate international flight data into dataset
  • Mobile application
×


CONTACT

Questions? Concerns? Reach out to us:

Pasadena, CA, US

Phone: +000 000 0000

Email: mail@mail.com